
OtherEN
Intro to Git — Snapshots, Branches & Sharing
 WorkshopyOfficial
10 stepsQuiz9 interactiveDiagram
gitversion controlbeginners
Used by 1 teacherBeginner
A/B testing explained with a simulator: split visitors at random, run 1,000 tests in a second, plan the sample size and catch false winners.
WorkshopyOfficial
78 lessons · used by 2 teachers
Sign in to copy it to your workspace. It’s free.
11 steps · 2 quizzes · open any step, or read it here
This A/B testing lesson starts with a question every team meets: a new version of a page (B) is ahead of the old one (A) after a day. Do you switch? Many teams get it wrong, because chance alone can open a lead between two pages that are exactly as good.
Interactive · Is B really better? The question this lesson answers — try it in the lesson
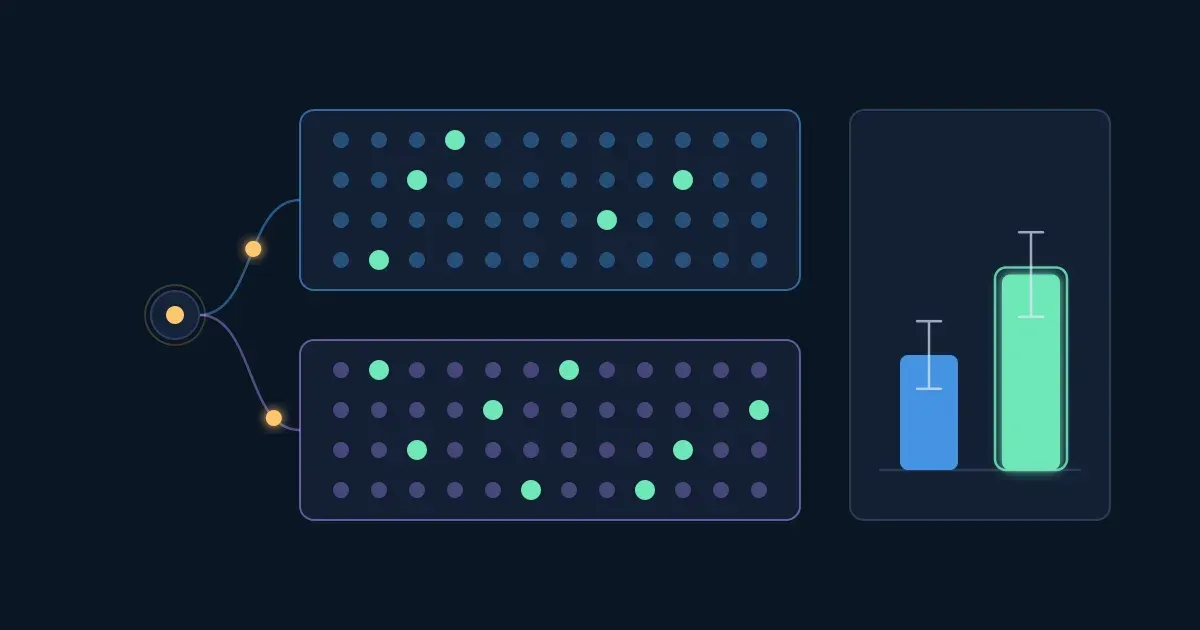
Watch the visitors split between the two versions and the bars on the right. By the end of this lesson you'll know when B's bar has really pulled clear, and when it only looks that way.
Every test runs in the lesson: no statistics background and no software needed.
In this lesson A/B testing is explained with a simulator: you split visitors between two versions of a page, run tests hundreds of times in a second, and learn when a winner is real. An A/B test shows version A (what you have) to some visitors and version B (the change) to others, picked at random, and compares what they do.
Press Send 40 visitors a few times, then Send 400. In this example B really is the better page. The thin line on each bar shows how far chance could still move that rate.
Interactive · Visitors split at random between two versions — try it in the lesson
All numbers in the lesson are illustrative, chosen to show the idea.
Takeaway: an A/B test is a comparison between two groups that differ only in the version they saw.
To credit a difference to the page, the two groups of visitors must be alike in everything else: new and returning customers, phones and computers, mornings and evenings. A coin flip per visitor does that for you, even for traits you never thought of.
Try it: the two versions below are the same page. Run the test with a coin flip, then with each of the other two ways of splitting.
Interactive · Two identical pages, three ways to split the visitors — try it in the lesson
What made B "win" when the evening visitors went to B? Who was in each group?
Takeaway: split at random, per visitor. Any other rule can hand one version the better customers.
Most broken tests break before they start. Write three things down before the first visitor arrives:
Try it: answer the three questions for the shop's change. Wrong answers explain themselves.
Interactive · Plan the test before it starts — try it in the lesson
Takeaway: decide the metric, the unit and the stopping rule before the test starts, and write them down.
Even with a perfect random split, the two groups never convert at exactly the same rate. Some visitors would have signed up anyway, and chance decides how many land in each group. An A/A test, two copies of the same page, shows how big those chance gaps are.
Try it: run 100 A/A tests at 2,000 visitors per version. Then move the slider to 100 and to 40,000 visitors and run them again.
Interactive · An A/A test: the same page twice, run many times — try it in the lesson
The green band holds 95% of the gaps chance makes. A real improvement has to stand out from that band to be seen. With four times as many visitors, the band is half as wide.
Takeaway: a gap between A and B is only news when it is bigger than the gaps chance makes on its own.
Question 1. Why should visitors be split between A and B at random?
Question 2. A shop shows version A on weekdays and version B at weekends. B sells more. What can you conclude?
Question 3. In an A/A test with 500 visitors per version and a 5% conversion rate, B comes out 1.5 percentage points ahead. What is the most likely reason?
Question 4. In an A/A test, you use four times as many visitors per version. What happens to the spread of the gaps chance makes?
A test tool turns the gap into a p-value. Ask: if A and B were really the same, how often would chance alone make a gap at least this big? That share is the p-value. When it is below 0.05 (5%), the result is called statistically significant.
The p-value is not the chance that B is better. It only says how surprising the gap would be if nothing had changed. Two things follow, and the simulator shows both:
Try it: run 1,000 tests with B the same as A. Then pick "10% better" and try 5,000 and 40,000 visitors per version.
Interactive · Run a test, then run it 1,000 times — try it in the lesson
How many visitors did the test need before it found the 10% improvement most of the time?
Takeaway: p < 0.05 means "a gap this big would be rare if nothing changed", not "B is 95% likely to be better".
The smaller the improvement you want to be able to find, the more visitors you need. Teams usually plan for a significance level of 5% and a power of 80%: if B really is better by the amount you chose, the test finds it 8 times out of 10. For a conversion rate, the visitors needed per version are about:
$$n = \frac{(1.96 + 0.84)^2 , [,p_1(1-p_1) + p_2(1-p_2),]}{(p_2 - p_1)^2}$$
where $p_1$ is A's rate and $p_2$ the rate you want to be able to detect. You don't need to work it by hand: the calculator below does it.
Try it: set A's rate to 5%, the smallest improvement to 10% and the visitors a day to 4,000. Then halve the improvement to 5% and watch the days.
Interactive · How many visitors a test needs — try it in the lesson
Check your work · With A's rate at 5%, the smallest improvement at 10% and 4,000 visitors a day, how many days does the test need? Paste the number of days. — check it in the lesson
Many teams also run a test for whole weeks, so weekdays and weekends both count.
Takeaway: work out the sample size before the start. Halving the improvement you want to find needs about four times the visitors.
Test tools show results from the first hour, and it's tempting to stop the moment B looks significant. That is called peeking, and it quietly breaks the 5% promise: every look is one more chance for noise to cross the line.
Try it: run a few single A/A tests in each mode. Then press Run 1,000 tests both ways.
Interactive · Peeking: stop at the first good-looking result — try it in the lesson
Looking 20 times instead of once makes false winners about five times as common, between two identical pages. If you need to watch a test as it runs (to stop a version that breaks something), use a method built for repeated looks, such as a sequential test in your tool, and decide that before the start.
Takeaway: decide the sample size first and read the result once, when it is reached.
A dashboard after a test often shows twenty numbers: orders, revenue, bounce rate, clicks on every button. Each one has its own 5% chance of looking significant by luck. Check enough of them and one will "win".
Try it: run one A/A test with 10 numbers, then with 20. Then run 1,000 tests and compare the red bar with the black mark.
Interactive · Check enough numbers and one will look like a winner — try it in the lesson
With 10 numbers the chance of at least one false winner is $1 - 0.95^{10}$, about 40%. With 20 it is about 64%. The same happens when you split the result into segments (country, device, new or returning) and look for one where B wins.
Takeaway: judge the test on its main metric. A win on a side metric or in one segment is an idea for the next test.
Use a calculator if you like. A wrong answer costs nothing, and each exercise has hints.
At the end of a test there are three honest choices: ship B, keep the test running (only when the planned sample isn't reached), or keep A. Read each result below against its plan and decide.
Try it: make the call on all four tests. Each answer explains itself.
Interactive · Four test results: what would you do? — try it in the lesson
Before you act on any test result, ask:
Takeaway: a result counts when it is on the main metric, at the planned sample, with a random split.
Question 1. What does p < 0.05 mean in an A/B test?
Question 2. You want the test to find a smaller improvement: 5% instead of 10%. What happens to the number of visitors it needs?
Question 3. A team checks its test every morning and stops as soon as p < 0.05. What is the problem?
Question 4. A test compares 20 numbers between A and B. Only one of them, not the main metric, comes out significant. What should the team do?
Question 5. A test reached its planned sample and found no significant difference. What does that show?
Question 6. Which belong in a test plan written before the test starts? (pick all that apply)
Workshopy shares this lesson under CC BY 4.0. Anyone may use and change it, with credit to you. Anyone can learn it here, free. A copy in your workspace is yours to change and run live; your students never need an account.
Version 2Current
· A new Start here step with the lesson's scene; the cover is now a frame of the simulator you play with.
Version 1
· First published
Copies are made from the current version. A copy you already have doesn’t change.
WorkshopyOfficial10 stepsQuiz9 interactiveDiagram
gitversion controlbeginners
WorkshopyOfficial16 steps2 quizzes15 interactiveDiagram
workshopyproduct touronboarding
WorkshopyOfficial10 steps2 quizzes10 interactive
data-literacystatisticsmean and median
WorkshopyOfficial11 steps2 quizzes10 interactive
data-literacycorrelationcausation
WorkshopyOfficial9 steps2 quizzes7 interactive
pythonpandasdataframe
WorkshopyOfficial10 steps2 quizzes9 interactive
excelsumifcountif



Comments
No comments yet. Be the first to say how it went.