OtherEN
Intro to Git — Snapshots, Branches & Sharing
 WorkshopyOfficial
10 stepsQuiz9 interactiveDiagram
gitversion controlbeginners
Used by 1 teacherBeginner
ChatGPT for data analysis training: describe your data, strip personal data, read the code and recount the AI's numbers on a sample export.
WorkshopyOfficial
78 lessons · used by 2 teachers
Sign in to copy it to your workspace. It’s free.
9 steps · 2 quizzes · open any step, or read it here
In this hands-on workshop you practise ChatGPT for data analysis the safe way: what to tell it about your data, what to ask for, and how to check its numbers before anyone acts on them. You work on one small support-ticket export and audit the assistant's answers yourself, row by row.
Here is the whole idea in one answer. The assistant gives a number that sounds right. Press Recount and watch where it went wrong.
Interactive · Check the assistant's number: a recount in four moves — try it in the lesson
In this lesson you'll:
It takes about an hour. Every AI reply here is a simulated example, written to show the mistakes real assistants make.
Takeaway: an assistant's number is a claim, not a result. It becomes a result once you've checked it.
Chat assistants are fast with data. Some only read what you paste; others (ChatGPT's data analysis is one) can open a file you upload and run code on it, usually Python. Either way they start knowing nothing about your file except what is in it.
A column called hours could be hours or days. A blank could mean zero, unknown or "not yet". Your period might be a quarter while the export starts a few days early. When the prompt doesn't say, the assistant guesses, and it doesn't tell you it guessed.
So before the question, give four facts:
Try it: add facts to the prompt. Each one removes a guess, and the simulated reply changes with it.
Interactive · Build a prompt that describes the data — try it in the lesson
Notice how the reply changed once it knew the period and the blanks: same file, a different number, and it now says what it left out.
Takeaway: one row, the units, the period, the blanks. Four sentences that turn a guess into a calculation.
An export from a work system carries more than your question needs: customer names, emails, phone numbers in free-text notes, staff names. None of that helps the assistant answer "how fast did we resolve tickets", and all of it is data your company is responsible for.
The habit is to decide column by column, before anything leaves your computer:
Free-text columns (notes, comments, descriptions) are the trap: they look harmless and hide phone numbers, names and account details. Drop them, or replace them with a category.
Never paste passwords, API keys or other secrets, whatever the tool. And use the AI tool your company has approved, under its data policy: that decides where your data goes and who may see it. These are habits, not legal advice; your policy says what applies to you.
Try it: decide for each column. Every choice tells you why.
Interactive · Strip the export before you paste it — try it in the lesson
Takeaway: paste the smallest table that answers the question. If a column names a person, it almost never needs to leave.
A bare number can't be checked. A number with its method can: you can read what the assistant did, step by step, and see the choice that changed the answer.
So ask for both, every time:
What was our average time to resolve a ticket in Q3 2026? Show the code or formula you used, say how many rows you used, and list any rows you left out and why.
An assistant that runs code (like ChatGPT's data analysis) can show you the code it ran, often Python with the pandas library. One that only reads your paste can give you a spreadsheet formula to run yourself, for example =AVERAGEIFS(H:H, B:B, ">="&DATE(2026,7,1), B:B, "<="&DATE(2026,9,30)) with the dates in column B and the hours in column H; it skips blank cells. You don't need to write either, only to read it line by line and ask: which rows does this keep, and what does it do with blanks?
Try it: run the assistant's code one line at a time and watch the hours column. Flag the two lines you'd question.
Interactive · Read the assistant's code, one line at a time — try it in the lesson
The giveaway was in plain sight: a start date of 28 June for a quarter that starts on 1 July, and a line that turns "still open" into "0 hours". Asking for the code made both visible.
Takeaway: ask for the method, the code and the row count. Then read which rows it kept and what it did with blanks.
Reading the code is one check. The other is to work the number out yourself, independently, with the simplest tool you have: a filter and a count, a sum, an average in a spreadsheet.
You don't recount everything. Recount the numbers someone will act on: the headline figure, a total, the group that "handled the most". A quick recount takes a minute and catches most errors, because most errors are about which rows were counted.
When your number differs, don't stop at "it's wrong". Ask which rows would give the assistant's number. That tells you what it did, and what to tell it.
Try it: the assistant summarised the quarter in three numbers. Use the filters to recount each one and type what you get.
Interactive · Recount the assistant's three numbers — try it in the lesson
All three wrong numbers came from two slips: the assistant used all 20 rows of the file, two of them from June, and read three blanks as zeros. Describing the period and the blanks (step 2) would have prevented both.
Check your work · Recount one more yourself: in the tool above, how many Q3 2026 tickets came in by Chat? Paste the number. — check it in the lesson
Takeaway: recount the numbers people will act on. When yours differs, find the rows that give the assistant's number.
Question 1. You ask for the average order value from a sales export. Which fact about the data helps the assistant most?
Question 2. Your export has columns order_id, date, customer_name, customer_email, product, amount, notes. You want total sales by product. What do you paste?
Question 3. The assistant answers "Average delivery time: 3.2 days." What should you ask next?
Question 4. The assistant says 240 orders in March. Your filter on March gives 226. What is the most useful next step?
Two errors hide in the last line of a calculation, the division.
The denominator. "47% of tickets were resolved within 4 hours" depends on what "tickets" means: all rows, the quarter's tickets, or only the resolved ones. Each is a different, true percentage of a different thing. The error is to compute one and say another. Ask: out of how many?
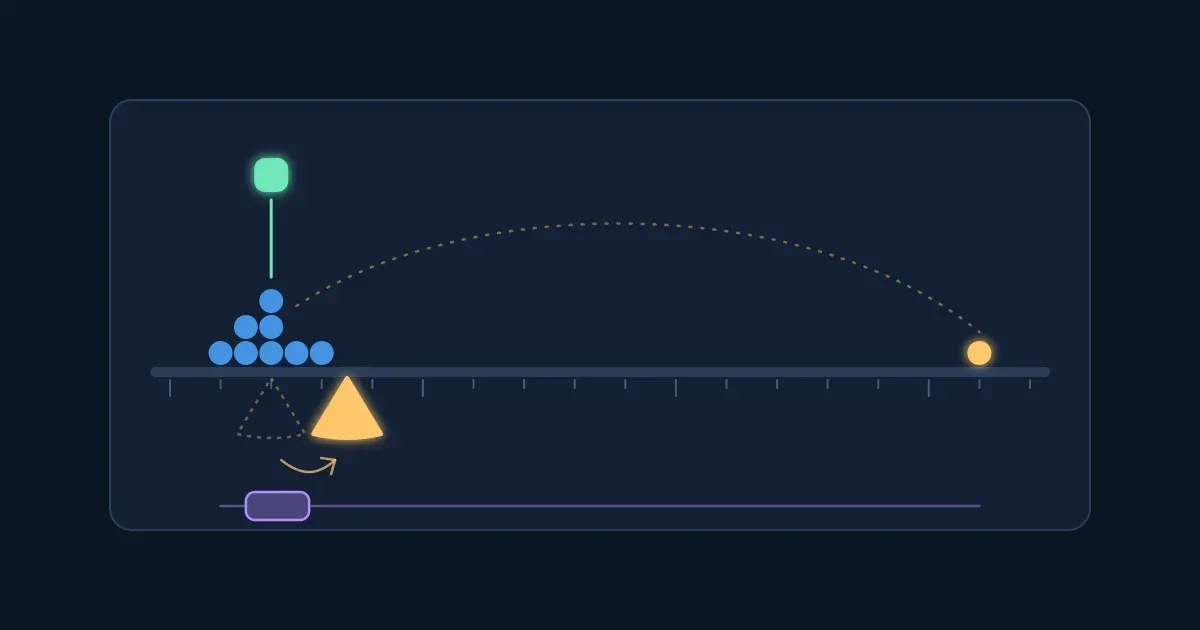
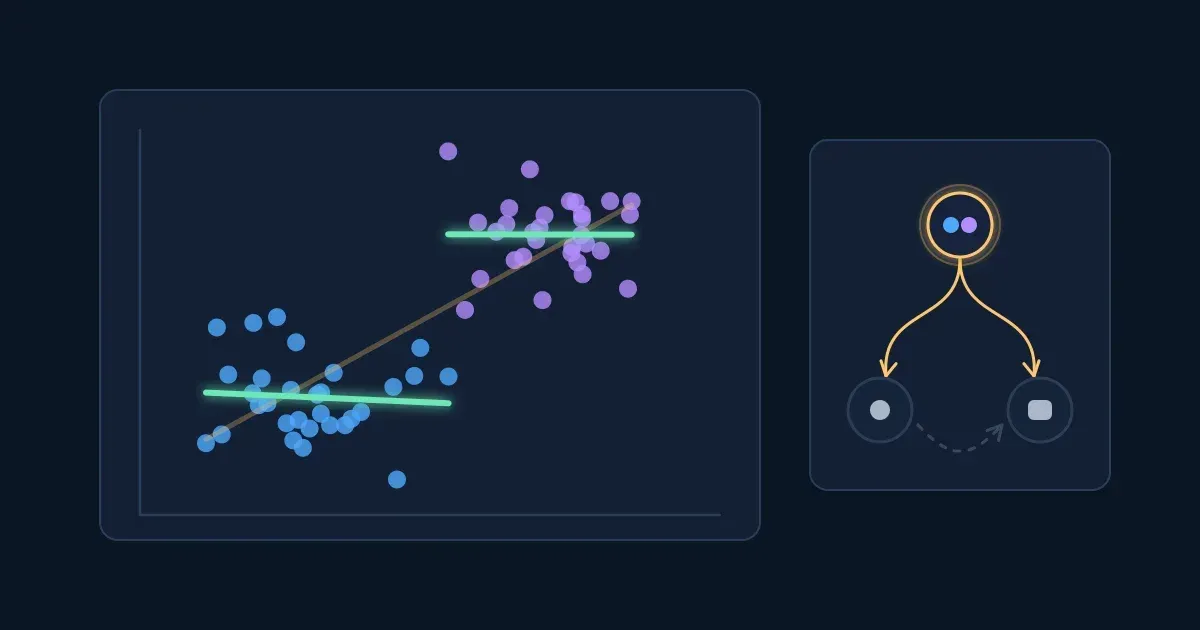
Averages of averages. If Email averaged 7.4 hours over 5 tickets and Chat 2.0 hours over 6, the overall average is not the middle of 7.4 and 2.0. Averaging the averages gives every group the same weight, however many tickets it has. The overall average is the total of all hours divided by all tickets. The bigger the groups differ in size, the further apart the two numbers get.
Try it: pick a denominator and see which one gives the assistant's 47%. Then switch to An average and drag the slider.
Interactive · What you divide by: percentages and averages of averages — try it in the lesson
Both errors give a clean, plausible number, so neither looks wrong. The only defence is to ask what was divided by what.
Takeaway: every percentage needs "out of how many", and an overall average is the total divided by the count, not the mean of group means.
Some claims in an AI's analysis come from nowhere. Asked for "insights", an assistant may state things no column could show: an escalation rate when there is no escalation column, a first-reply time when only closing time was recorded. They read like the rest of the answer.
Others are built on something real and then go one step too far. In these tickets, longer waits do go with lower scores. But "so answering faster will raise satisfaction" is a cause, and the data only shows that the two move together. Hard problems take longer and annoy customers; the difficulty could be behind both. Patterns are worth reporting; causes need more than a spreadsheet, such as a test or a deeper look.
For each claim, ask two questions:
Try it: sort the assistant's four insights. The columns you pasted light up for the claims they can check.
Interactive · In the data, not in the data, or a cause the data can't show? — try it in the lesson
Takeaway: tie every claim to a column. If it says "because", check whether the data can really say that.
These exercises use the Q3 2026 tickets (1 July – 30 September) from the lesson. A blank in hours means the ticket is still open; a blank in csat means no survey reply. All data is illustrative.
| ticket | opened | region | channel | hours | csat |
|---|---|---|---|---|---|
| T-103 | 2026-07-02 | North | Phone | 8 | 3 |
| T-104 | 2026-07-06 | South | 12 | 2 | |
| T-105 | 2026-07-09 | West | Chat | 1 | 5 |
| T-106 | 2026-07-14 | West | 6 | 4 | |
| T-107 | 2026-07-21 | South | Phone | 9 | |
| T-108 | 2026-07-28 | North | Chat | 3 | 5 |
| T-109 | 2026-08-03 | West | Phone | 7 | 3 |
| T-110 | 2026-08-11 | South | Chat | 2 | 4 |
| T-111 | 2026-08-17 | North | |||
| T-112 | 2026-08-24 | West | 10 | 2 | |
| T-113 | 2026-08-31 | South | 4 | 4 | |
| T-114 | 2026-09-04 | North | Phone | 6 | |
| T-115 | 2026-09-10 | West | Chat | 2 | 5 |
| T-116 | 2026-09-15 | South | Phone | ||
| T-117 | 2026-09-21 | West | Chat | 1 | 4 |
| T-118 | 2026-09-23 | North | 5 | 3 | |
| T-119 | 2026-09-28 | West | Phone | ||
| T-120 | 2026-09-29 | South | Chat | 3 | 5 |
The two June tickets in the full export were T-101 (North, Email, 5 hours, csat 4) and T-102 (West, Chat, 2 hours, csat 5).
A checked number still needs to travel well. Most findings go to someone as a chart and a few sentences, and that is where the caveats get lost.
Pick the chart for the comparison you're making:
Then the note: the finding, plus what a reader needs to trust it. The period and the count. What was left out and why. Where the number is shaky (a small group). How it was checked. And no cause the data can't show.
Assistants are good at drafting both. Ask for the chart and a draft note, then check the note against this list before it goes out.
Try it: fix the assistant's chart, then build the note from the sentences offered.
Interactive · Turn the finding into a chart and a note with caveats — try it in the lesson
Takeaway: bars to compare, lines for time, pies only for parts of a whole. A note carries the period, the count, what was left out and where it's shaky.
Question 1. A colleague asks an assistant "What's our churn rate?" and pastes a customer list. What is missing from the prompt?
Question 2. Which of these should never be pasted into an AI tool for a question about sales by region? (pick all that apply)
Question 3. The assistant's code contains `df["revenue"] = df["revenue"].fillna(0)` before it computes the average revenue per order. Why does that matter?
Question 4. Store A averaged 40 sales a day over 30 days; store B averaged 10 a day over 5 days. The assistant reports "the stores averaged 25 sales a day". What is the average over all 35 store-days?
Question 5. The assistant writes: "Customers who used the mobile app spent more, so pushing everyone to the app will raise revenue." What is the problem?
Question 6. You want to send the finding "Chat tickets were resolved fastest in Q3". Which note is best?
Workshopy shares this lesson under CC BY 4.0. Anyone may use and change it, with credit to you. Anyone can learn it here, free. A copy in your workspace is yours to change and run live; your students never need an account.
Version 1Current
· First published
Copies are made from the current version. A copy you already have doesn’t change.
WorkshopyOfficial10 stepsQuiz9 interactiveDiagram
gitversion controlbeginners
WorkshopyOfficial16 steps2 quizzes15 interactiveDiagram
workshopyproduct touronboarding
WorkshopyOfficial10 steps2 quizzes10 interactive
data-literacystatisticsmean and median
WorkshopyOfficial11 steps2 quizzes10 interactive
data-literacycorrelationcausation
WorkshopyOfficial9 steps2 quizzes7 interactive
pythonpandasdataframe
WorkshopyOfficial10 steps2 quizzes9 interactive
excelsumifcountif

Comments
No comments yet. Be the first to say how it went.