OtherEN
Intro to Git — Snapshots, Branches & Sharing
 WorkshopyOfficial
10 stepsQuiz9 interactiveDiagram
gitversion controlbeginners
Used by 1 teacherBeginner
Data literacy training for employees: read averages, percentages, surveys and rankings at work, with hands-on charts and exercises you check as you go.
WorkshopyOfficial
78 lessons · used by 2 teachers
Sign in to copy it to your workspace. It’s free.
9 steps · 2 quizzes · open any step, or read it here
In this data literacy training for employees you practise reading the numbers that reach you at work — averages, percentages, survey results, rankings — and asking what they really say before you decide anything. Each step gives you a small piece of real-looking work data to change and watch.
A number on a dashboard is usually true. The trouble is what we read into it. Press Next below and watch one true headline turn out to mean something else.
Interactive · One headline, looked at closely — try it in the lesson
In this lesson you'll:
It takes about 60 minutes. You need nothing but this page.
Takeaway: a true number can still answer a different question from the one you are asking.
The average (mean) adds every value and divides by how many there are. The median lines the values up and takes the one in the middle. When most values are close together and a few are far away — deal sizes, salaries, time to resolve a ticket, house prices — the two tell different stories.
The average answers "how much in total, shared out equally?". The median answers "what does a typical case look like?". Both are useful; the trouble starts when a report says "average" and we hear "typical".
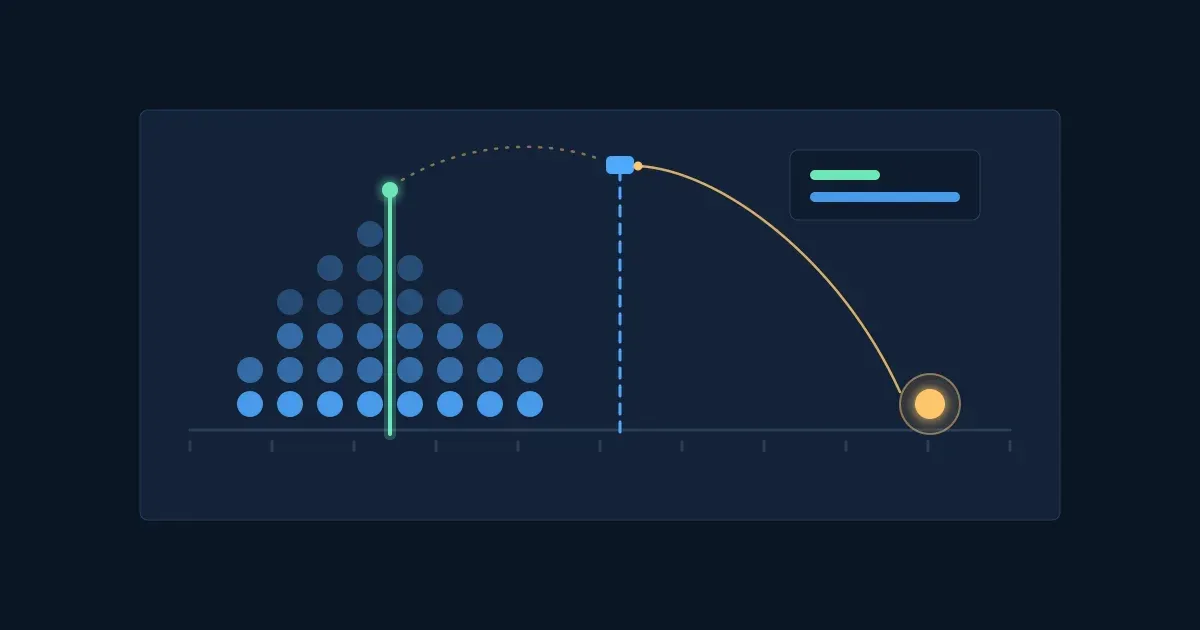
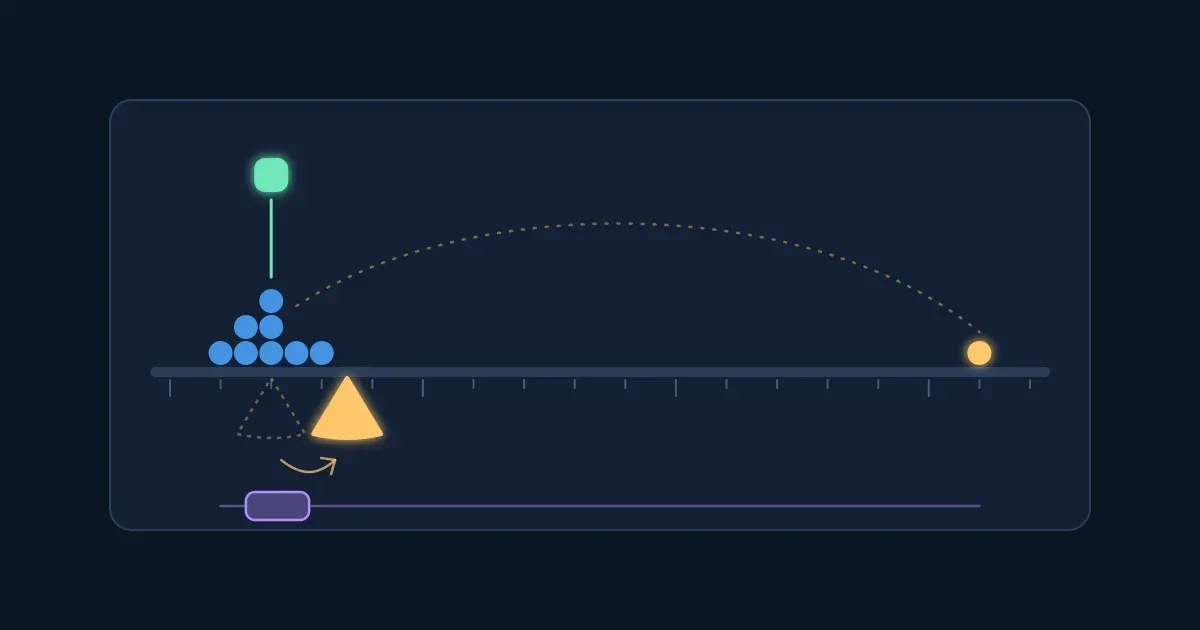
Try it: the block shows 12 deals a sales team closed this quarter, in thousands of dollars. Drag the biggest deal up and down. Watch which marker moves, and count how many deals sit above the average.
Interactive · Twelve deals: the average and the median — try it in the lesson
Move the biggest deal from $30k to $500k: the average climbs steadily while the median barely moves, and soon only one or two deals are "above average". That is why pay, house prices and response times are usually reported as medians.
When you see an average in a report, ask: is this the typical case, or the total shared out? If a few cases are far from the rest, ask for the median too.
Takeaway: the average is pulled by extremes; the median shows the typical case. A report should say which one it uses.
"Up 50%" sounds big. Whether it is depends on the base — the number it grew from. Two more signups on a base of four is +50%. So are two thousand more on a base of four thousand. The percent is the same, the business news is not.
A second trap hides in rates that are already percentages, such as conversion, churn or error rates. If conversion goes from 2% to 3%, it rose by 1 percentage point — and by 50%, because 1 is half of 2. Both are true; a report that says "conversion up 50%" and one that says "up 1 point" describe the same week.
Try it: in Percent change, change last month's number and watch what +50% means in signups. In Percentage points, move the new conversion rate and compare the two ways of saying the same change.
Interactive · Percent of what, and points versus percent — try it in the lesson
When a report gives a percent, find the base before you react. When a rate changes, check whether the report means points or percent — "churn up 25%" might be 4% becoming 5%.
Takeaway: a percent without its base says little, and a change in a rate can be told in points or in percent — they are different numbers.
Four questions on the last three steps.
Question 1. A team of 10: nine people earn \$50k a year and the founder earns \$1,050k. What is the average salary?
Question 2. In the same team, which number best describes what a typical person earns?
Question 3. The share of orders that are returned went from 2% to 3%. Which statement is right?
Question 4. A report says "Bug reports up 300% this week". What do you need to know first?
Most numbers about people come from a sample — the customers who filled in a survey, the staff who answered a poll, the users who clicked "rate us". A sample can stand in for everyone only if the people in it are like everyone. When some people are more likely to answer than others, the result leans their way, however many answers come in.
This is called response bias (or selection bias). Happy customers rate the app when it prompts them; angry ones write to support instead. Staff who read the newsletter vote in the newsletter poll. More answers don't fix it: they only make the wrong number look more certain.
Try it: 200 customers, and 70% of them are satisfied — that is the true number. Send the survey, then make unhappy customers less likely to reply and send it again. Watch the survey's result move away from 70%.
Interactive · A survey where some customers reply more than others — try it in the lesson
Set both sliders equal and the survey lands near 70%, give or take chance. Make satisfied customers reply three times as often and it says close to 88% — with plenty of replies. Before trusting a survey, ask who could answer, and who was likely to?
Takeaway: a sample tells you about the people in it. If some kinds of people answer more, the result leans their way, and more answers don't fix that.
A rate measured on a few cases jumps around by chance. One sale out of 20 visits is 5%; three sales is 15%. Out of 2,000 visits, the rate barely moves from week to week. So when you rank stores, teams, reps or schools by a rate, the top and the bottom of the list are often the smallest ones — not the best and the worst.
This catches out awards ("store of the month"), worries ("this team's error rate doubled") and decisions to copy what "the best" does. Before ranking by a rate, look at how many cases each one is based on.
Try it: 12 stores sell at exactly the same true rate, 5%. Only their size differs, from 20 to 2,000 visits a week. Run a few weeks. Watch where the best and the worst store land, and how wide the small stores swing.
Interactive · Twelve stores, the same true rate, different sizes — try it in the lesson
The dots spread out into a funnel: wide on the left, where stores are small, narrow on the right. "Best store" and "worst store" keep changing, and they are usually small. Nothing about those stores is different — only the number of visits.
Before you rank by a rate, ask how many cases is each number based on? Compare small groups over longer periods, or group them together.
Takeaway: rates from small groups swing by chance, so the top and bottom of a ranking are often just the smallest groups.
Two numbers that move together tempt us to say one causes the other. "Customers who use the app spend more, so let's push everyone to the app." Often a third factor drives both: the customers who spend most were always the ones who installed the app.
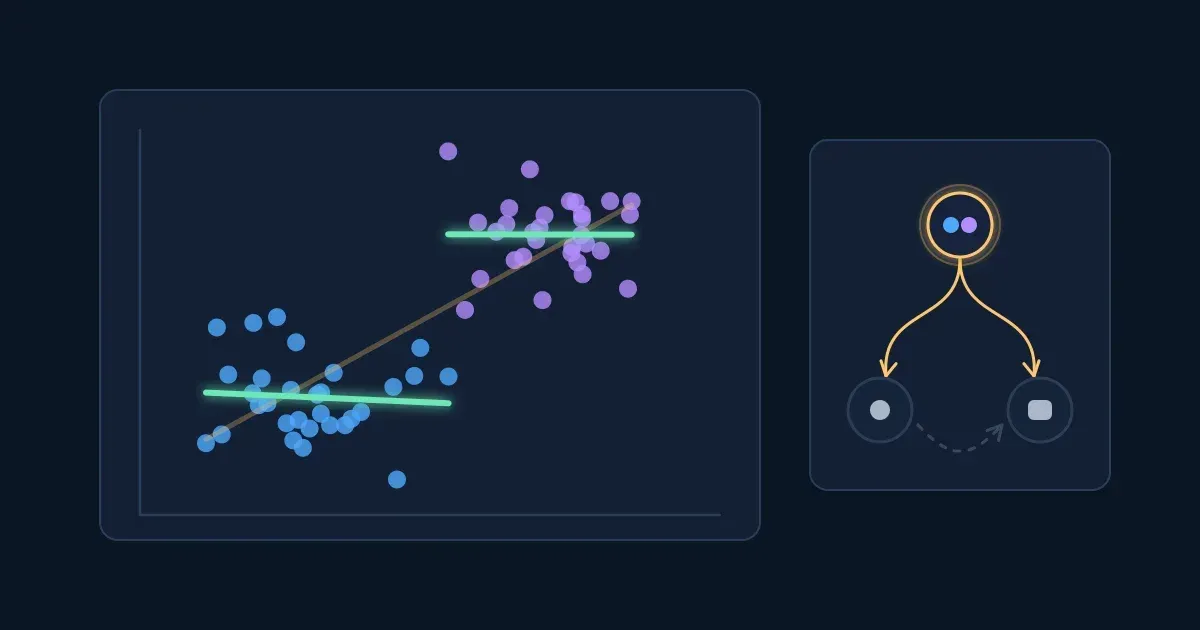
A third factor can even turn a comparison upside down. Below, Team A resolves more support tickets within a day than Team B. But Team B gets most of the hard tickets. Compare like with like — easy tickets with easy, hard with hard — and Team B does better on both. (This reversal is called Simpson's paradox; the numbers here are illustrative.)
Try it: start with All tickets and decide which team is better. Then press Split by ticket type.
Interactive · Two support teams, all tickets and split by type — try it in the lesson
The overall numbers aren't wrong; they mix two different kinds of work. Whenever a comparison could hide a difference in mix — hard and easy tickets, big and small accounts, new and returning customers — compare within each kind first.
When two things move together, ask what else could explain it? Who chose to do what, and what else changed at the same time?
Takeaway: before reading a pattern as cause and effect, look for a third factor — often a difference in who or what is being compared.
Numbers often reach us as charts, and a chart can make a small change look large. The most common way is a value axis that doesn't start at zero: the bars are cut off at the bottom, and what is left exaggerates the gap.
Revenue went from $4.1M to $4.3M — about 5% more. Try it: raise the point where the axis starts and watch how much taller the second bar looks, while the numbers stay the same.
Interactive · Where the axis starts — try it in the lesson
At $4.0M the second bar looks three times as tall for a 5% rise. Bars should start at zero; when a chart's axis doesn't, read the numbers on the axis, not the height of the bars. More ways a chart can mislead are in the lesson How Charts Lie.
Takeaway: a bar's height means something only if its axis starts at zero; otherwise read the numbers.
Six short exercises from the kind of report you get at work. Type the number only — no % sign, no currency. A hint costs nothing.
Every trap in this lesson is caught by one question. Ask them, in any order, before you act on a number:
Try it: five claims from a working week. For each one, pick the question that exposes it. A wrong pick tells you why it isn't the best one.
Interactive · Five claims, five questions — try it in the lesson
Keep the five questions next to your next dashboard or report. Most numbers pass them in a minute; the ones that don't are the ones worth a second look before a decision.
Takeaway: five questions — average or typical, percent of what, who is counted, how many cases, what else could explain it — catch most misleading numbers at work.
Six questions on the whole lesson.
Question 1. A customer survey gets replies mostly from happy customers. What happens to its "% satisfied"?
Question 2. The store with the best conversion rate last week had only 20 visitors. What is the most likely reason?
Question 3. Team A resolves more tickets within a day overall, but Team B does better on easy tickets and on hard tickets. What explains it?
Question 4. A bar chart shows 96% and 98%, with the axis starting at 95%. What should you take from it?
Question 5. "Average deal size up 30% this month." Which questions should you ask before acting on it? (pick all that apply)
Question 6. Employees who attend more training sessions get higher performance ratings. What is the best conclusion?
Workshopy shares this lesson under CC BY 4.0. Anyone may use and change it, with credit to you. Anyone can learn it here, free. A copy in your workspace is yours to change and run live; your students never need an account.
Version 1Current
· First published
Copies are made from the current version. A copy you already have doesn’t change.
WorkshopyOfficial10 stepsQuiz9 interactiveDiagram
gitversion controlbeginners
WorkshopyOfficial16 steps2 quizzes15 interactiveDiagram
workshopyproduct touronboarding
WorkshopyOfficial10 steps2 quizzes10 interactive
data-literacystatisticsmean and median
WorkshopyOfficial11 steps2 quizzes10 interactive
data-literacycorrelationcausation
WorkshopyOfficial9 steps2 quizzes7 interactive
pythonpandasdataframe
WorkshopyOfficial10 steps2 quizzes9 interactive
excelsumifcountif


Comments
No comments yet. Be the first to say how it went.