OtherEN
Intro to Git — Snapshots, Branches & Sharing
 WorkshopyOfficial
10 stepsQuiz9 interactiveDiagram
gitversion controlbeginners
Used by 1 teacherBeginner
Kanban training exercise for teams: build a board, set WIP limits in a flow simulator and watch lead time fall. Practise Little's Law and read a CFD.
WorkshopyOfficial
78 lessons · used by 2 teachers
Sign in to copy it to your workspace. It’s free.
10 steps · 2 quizzes · open any step, or read it here
This Kanban workshop starts with a problem most teams know: more work gets started than finished. Everyone is busy and the board is full, yet each request still takes weeks to get done.
Interactive · Start everything, or limit work in progress? — try it in the lesson
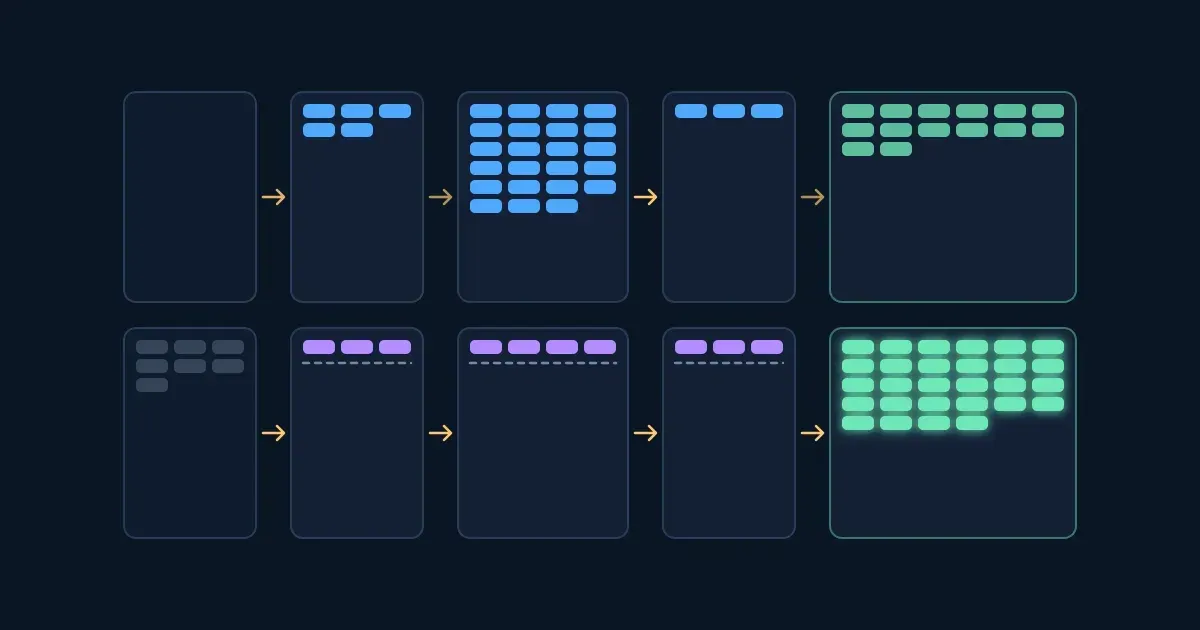
You just watched one team with the same requests on two boards. On the top board everything starts at once and piles up in Build; on the bottom board each column has a work-in-progress limit, and far more reaches Done. By the end of this lesson you can set those limits on your own team's board.
You need a laptop or tablet. No Kanban experience needed.
In this Kanban workshop you visualize your team's work on a board and learn why limiting work in progress makes each item finish sooner. You will run a small flow simulator, set WIP limits yourself and watch lead time fall while the team gets just as much done.
Below are two copies of the same team with the same requests. On the top board everyone starts work the moment it arrives. On the bottom board each column has a limit on how many items it may hold. Press Play and watch where the work piles up.
Interactive · Same team, same requests: start everything or limit WIP — try it in the lesson
The lead time shown is the average for items finished in the last two weeks: how long an item took from the moment the team started it until it was done. The numbers are illustrative, but the pattern is the one teams see on real boards.
Takeaway: starting less work is how each piece of work finishes sooner.
Kanban started on Toyota's factory floor, where a kanban (Japanese for "signboard" or "card") told the previous station to make more parts. The Kanban Method for knowledge work was worked out by David J. Anderson in the mid-2000s and described in his 2010 book Kanban. Its first rule is gentle: start with what you do now. You don't reorganise the team or rename roles. You draw the work as it really flows today.
A board has columns for the stages work passes through, and one card per piece of work. The simplest board is To do · Doing · Done. Every card says what the work is, so anyone can read the board in a minute and know:
The last one matters most. A blocked item is one that can't move because it waits on someone outside the team: a supplier, another department, a customer's answer. Mark it so everyone sees it, with a red sticker or a flag.
Try it: here is a support team's work this morning, unsorted. Tap a card, then tap Move here under the column where it belongs. Then flag the item that is stuck.
Interactive · Sort a support team's work onto a board — try it in the lesson
Takeaway: draw the work as it flows today, one card per item, and make blocked work impossible to miss.
In a push system, each stage hands work on as soon as it's finished, whether the next stage has room or not. Work piles up in front of the slowest stage, the bottleneck, and every item in that pile ages while nobody touches it.
In a pull system, a stage takes new work only when it has room. That room is set by a work-in-progress (WIP) limit: the most items a column may hold at once, written at the top of the column ("Build 4"). When a column is full, the stage before it doesn't push more in. Its people help finish what is already started, or fix what slows the bottleneck.
Try it: a content team's writers can draft 3 articles a day, and the one editor can review 2. Play 10 days with Push, then switch to Pull, limit 2 and play again.
Interactive · Push or pull: a queue in front of the bottleneck — try it in the lesson
After 10 days both teams have reviewed the same 18 articles, because the editor is the bottleneck either way. With push, 12 drafts are waiting and each finished article sat in the queue 2.5 days on average, and the wait grows every day. With pull, only 2 are waiting and the average wait is 1 day.
A few rules for WIP limits:
Takeaway: a WIP limit turns push into pull, and the queue in front of the bottleneck stops growing.
Now a whole board. A product team gets requests into its Backlog. When the team commits to an item it pulls it into Analyse, then Build, then Test, then Done. Build is the slowest stage: on average it can finish about 1.6 items a day. New requests arrive at 1.5 a day, and 12 are already waiting on day 1.
Three numbers tell you how work flows:
Each slider sets the column's WIP limit; slide it all the way right for no limit. Every run uses the same requests, so you can compare runs fairly. Your runs are listed under the numbers.
Try it: do the three tasks at the top of the simulator.
Interactive · Kanban flow simulator: set WIP limits, watch lead time — try it in the lesson
What you should see:
The work that isn't started yet waits in the Backlog, before the commitment point, where waiting is cheap: nothing is half-done and the team can still change its mind about it. A growing backlog is honest information too. It says demand is higher than the team's capacity, which is a conversation to have with whoever sends the work.
The numbers in this simulator are illustrative. Real teams have more variation, but the direction is the same.
Takeaway: limit WIP to the level that keeps the bottleneck busy. Less than that starves it, more than that only adds waiting.
Question 1. A column on your board has a WIP limit of 3 and holds 3 items. You just finished your own item in the column before it. What does a pull system say you do?
Question 2. What is a blocked item?
Question 3. In the simulator, removing every WIP limit mainly changed which number?
Question 4. Why did very tight limits (1 · 1 · 1) lower throughput?
The simulator's result isn't luck. It follows from Little's Law, proved by John Little in 1961 for any stable queue. Written the way Kanban teams use it:
$$\text{average WIP} = \text{throughput} \times \text{average lead time}$$
Rearranged for the number you usually care about:
$$\text{average lead time} = \frac{\text{average WIP}}{\text{throughput}}$$
If a team has 12 items in progress and finishes 2 a day, a new item will take about 12 ÷ 2 = 6 days on average. To make it 3 days without working any faster, the team has to hold only 6 items in progress.
Three conditions keep it honest:
Try it: move the sliders. Keep throughput at 2 a day and halve the work in progress. What happens to lead time?
Interactive · Little's Law: work in progress, throughput and lead time — try it in the lesson
Takeaway: at the same throughput, lead time moves in step with WIP. Halve WIP, halve lead time.
Use average WIP = throughput × average lead time. Give each answer as a plain number in the unit the question asks for.
Teams use two words for "how long", and the definitions vary from book to book and tool to tool:
Neither is wrong. What matters is that your team picks its two points, writes them on the board and measures every item the same way.
Try it: press each button and watch which part of one item's life it measures.
Interactive · Lead time and cycle time on one card — try it in the lesson
To get a number, note the day each card starts and the day it finishes. Here are five cards from a team's board. Work out the average cycle time as "finish day minus start day".
| Card | Started on day | Finished on day |
|---|---|---|
| A | 3 | 7 |
| B | 4 | 10 |
| C | 5 | 8 |
| D | 7 | 12 |
| E | 8 | 10 |
Check your work · Paste the average cycle time of cards A to E, in days. — check it in the lesson
Takeaway: say which two points you measure between, then measure every item the same way.
A cumulative flow diagram (CFD) shows a board over time. Each day, it stacks how many items have ever reached each column: Done at the bottom, then Test, Build, Analyse and Backlog. Because items only move forward, each band's top edge can only rise or stay flat.
How to read it:
Try it: switch between the two boards from the simulator. Move the day slider and compare how tall the middle bands are and how far right you go before Done catches up.
Interactive · A cumulative flow diagram, with and without WIP limits — try it in the lesson
Without limits, the blue Build band swells to around 30 items and Done takes weeks to catch up with what was started. With limits, the middle bands stay thin and parallel: the sign of steady flow. The work waiting moves up into the grey Backlog band, before the commitment point.
Takeaway: parallel bands mean steady flow; a widening band shows where work piles up.
A board only works when everyone uses it the same way. The Kanban Method calls this making policies explicit: the team writes down how work moves and keeps it next to the board. Typical policies:
Classes of service say that not all work is the same. Four common ones, described by David J. Anderson:
| Class of service | Example | Typical policy |
|---|---|---|
| Expedite | A production outage | Work on it now, even above the limit. Only one at a time. |
| Fixed date | A legal deadline, a launch event | Start early enough to finish before the date. |
| Standard | Most requests | First in, first out, within the WIP limits. |
| Intangible | Paying down technical debt, updating a template | Pulled when there is room; it matters later. |
Try it: four situations from a team's stand-up. Choose what a team with these policies does.
Interactive · Stand-up decisions: what do the policies say? — try it in the lesson
Takeaway: write the rules down beside the board, so the board means the same thing to everyone.
Question 1. Which of these are core practices of the Kanban Method? (pick all)
Question 2. A team finishes 4 items a day and has 24 items in progress on average. By Little's Law, what is the average lead time?
Question 3. On a cumulative flow diagram, the Test band gets wider every week. What does that tell you?
Question 4. In the Kanban Method, lead time is usually measured from:
Question 5. A production outage arrives and the board's policy allows one Expedite item at a time. What happens?
Question 6. Why does a team with no WIP limits usually not finish more work than a team with sensible limits?
Workshopy shares this lesson under CC BY 4.0. Anyone may use and change it, with credit to you. Anyone can learn it here, free. A copy in your workspace is yours to change and run live; your students never need an account.
Version 2Current
· A new Start here step with the lesson's scene; the cover is now a frame of the two boards you run in the lesson.
Version 1
· First published
Copies are made from the current version. A copy you already have doesn’t change.
WorkshopyOfficial10 stepsQuiz9 interactiveDiagram
gitversion controlbeginners
WorkshopyOfficial16 steps2 quizzes15 interactiveDiagram
workshopyproduct touronboarding
WorkshopyOfficial10 steps2 quizzes10 interactive
data-literacystatisticsmean and median
WorkshopyOfficial10 steps2 quizzes9 interactive
managementokrgoal setting
WorkshopyOfficial10 steps2 quizzes9 interactive
managementproject managementcritical path
WorkshopyOfficial10 steps2 quizzes9 interactive
managementtime managementeisenhower matrix
Comments
No comments yet. Be the first to say how it went.